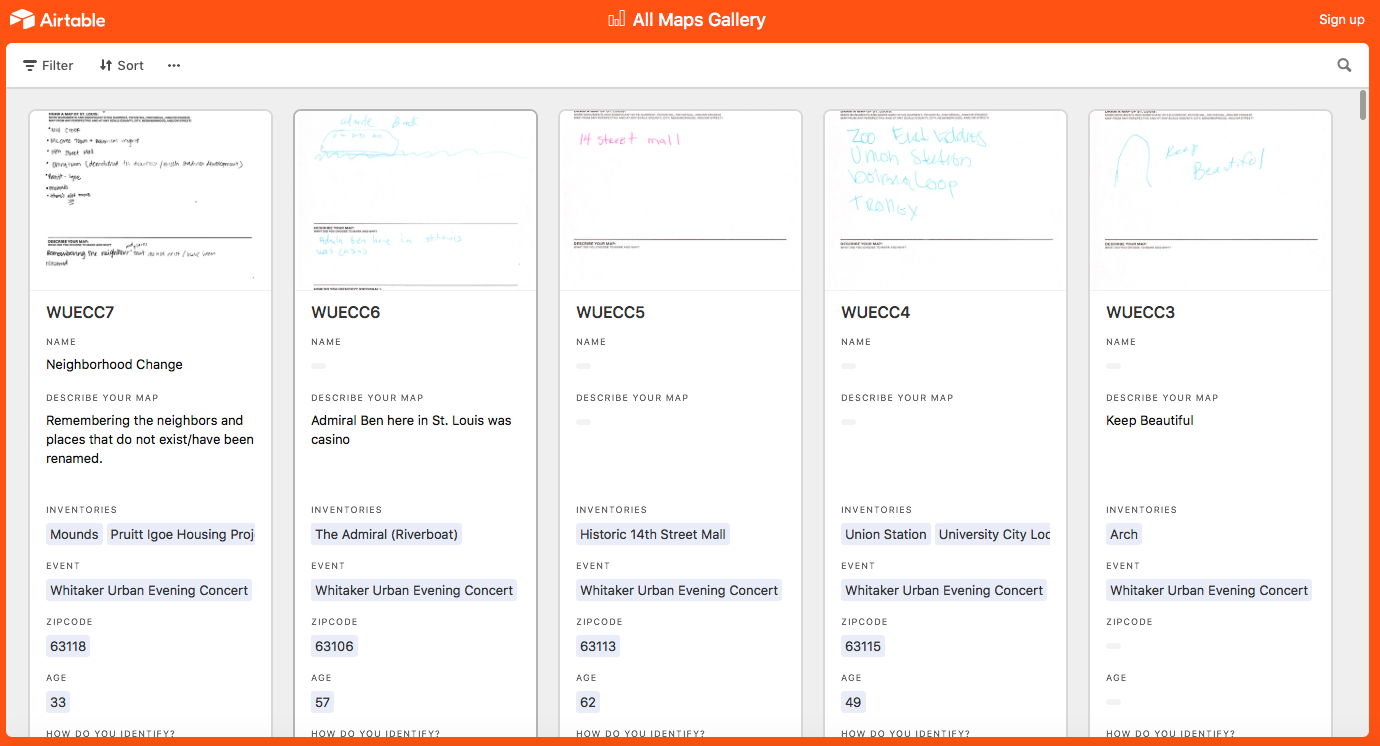
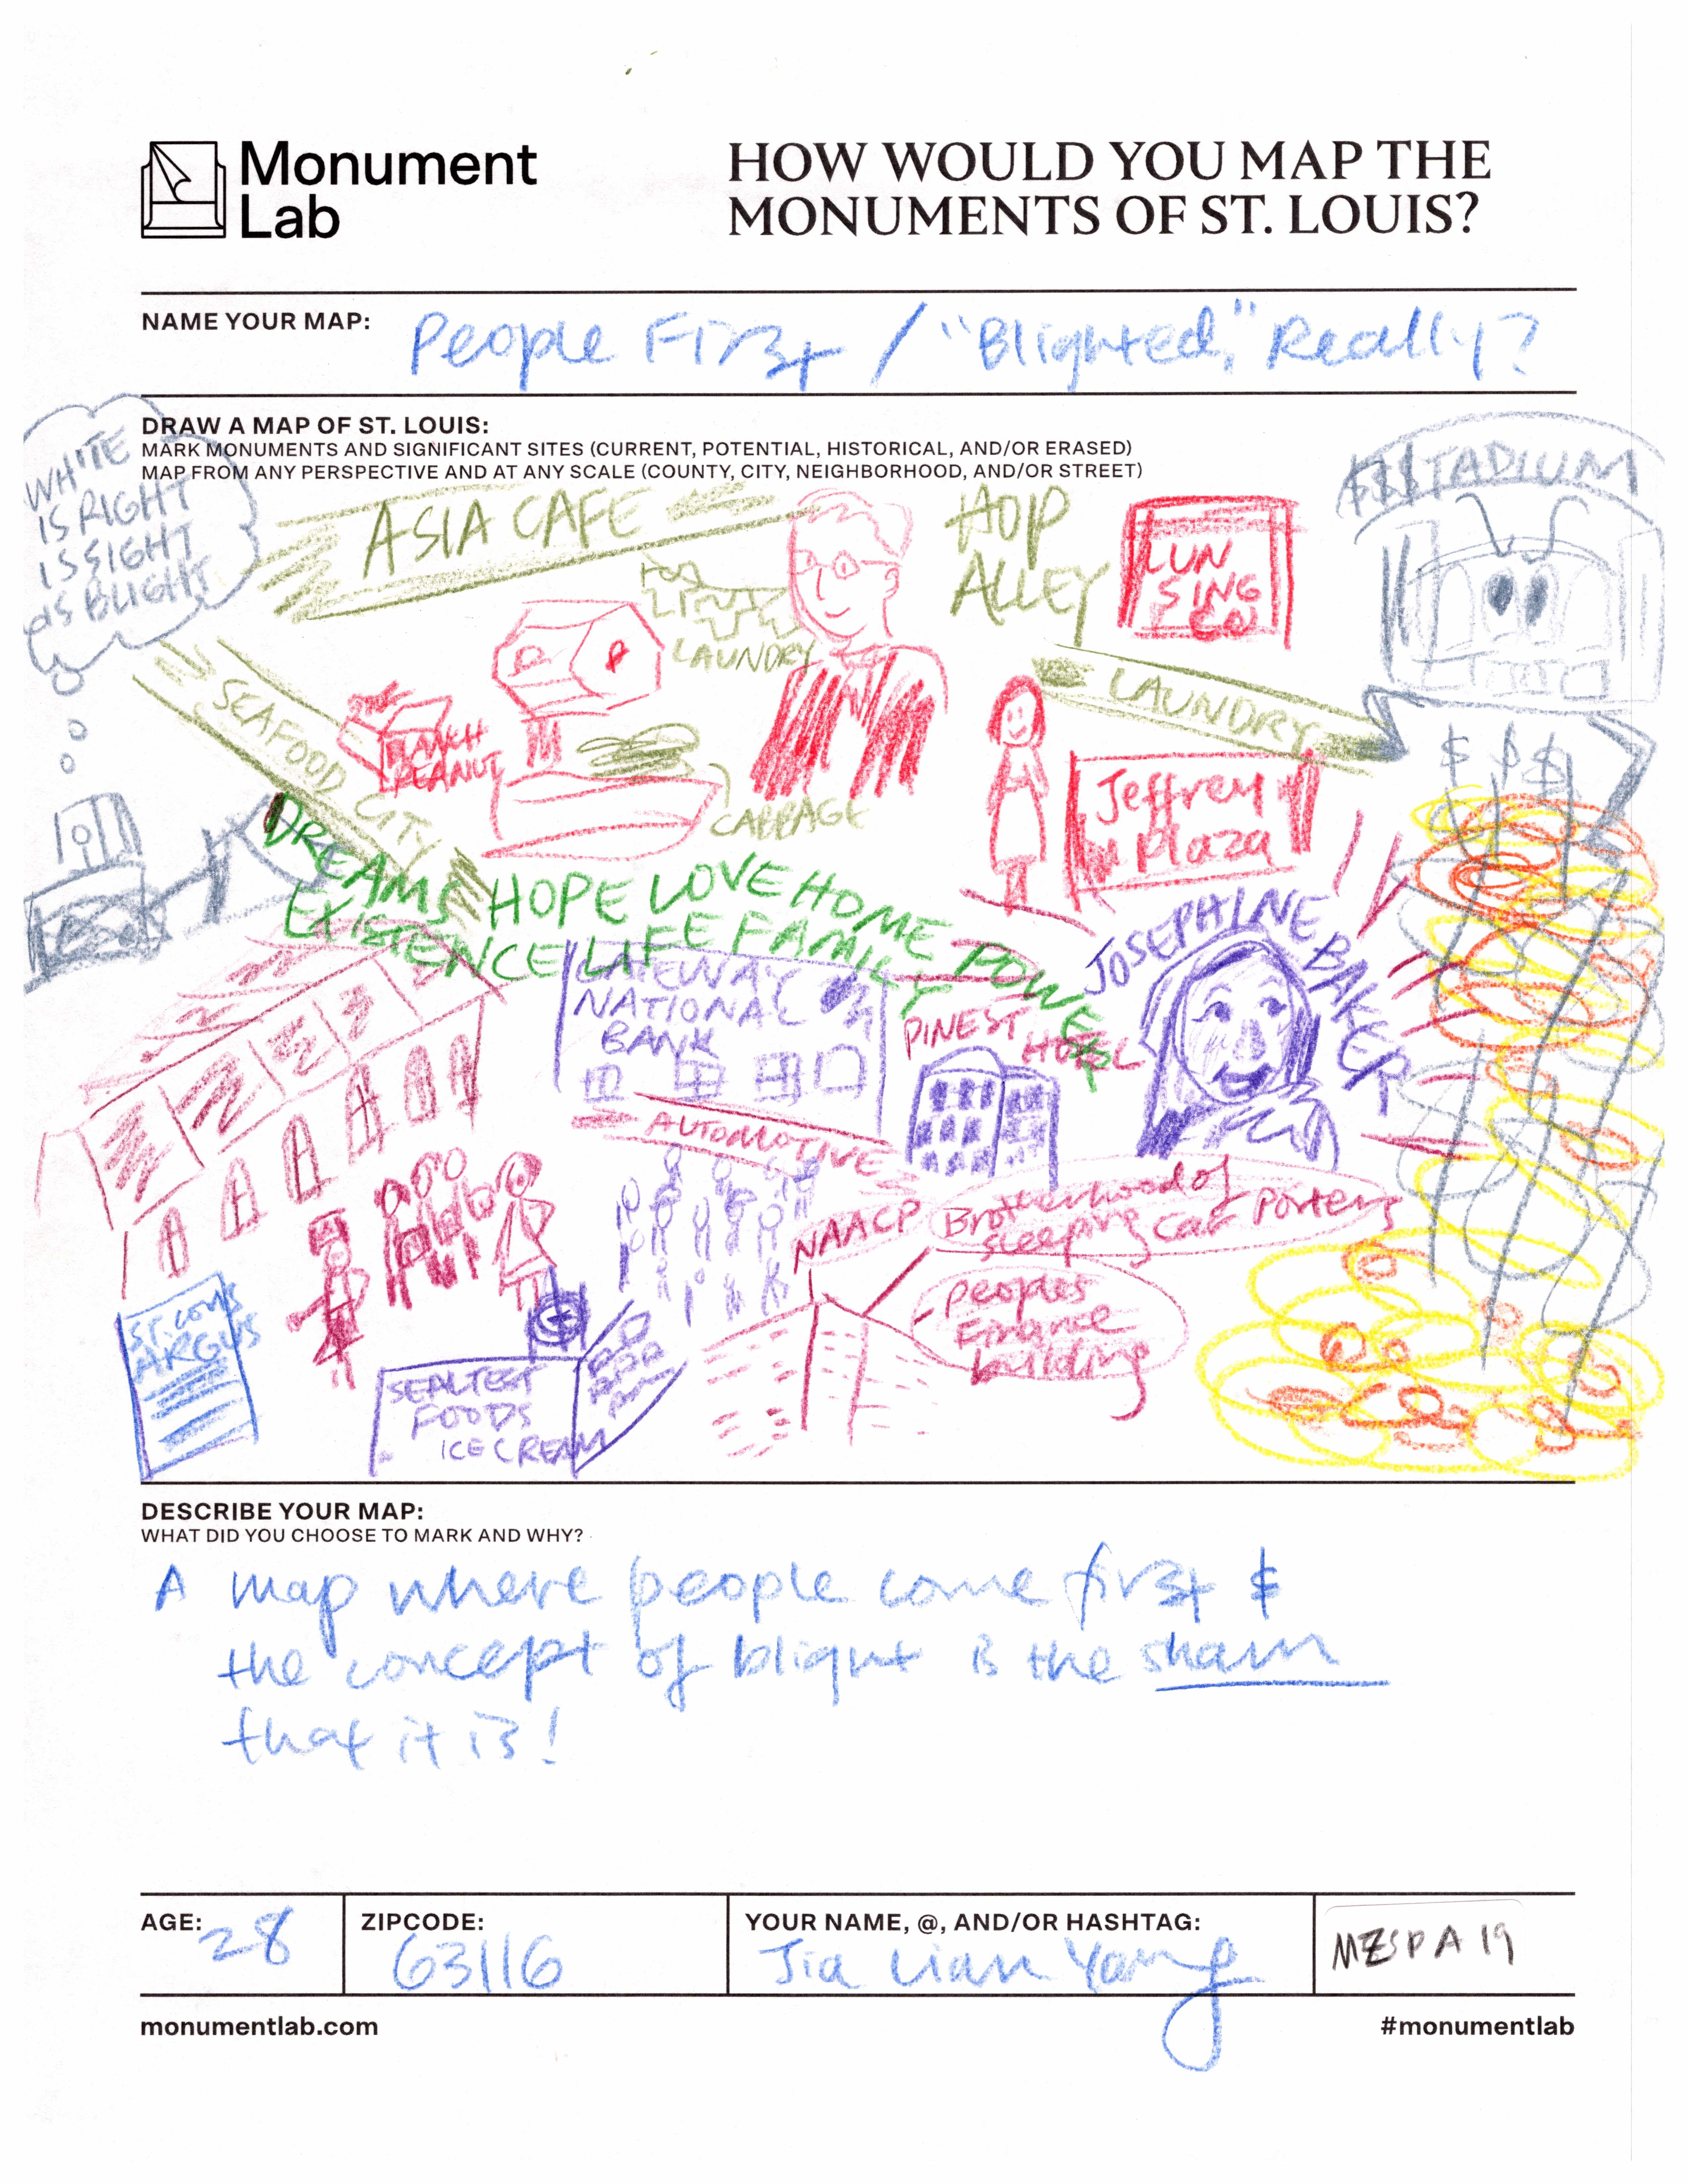
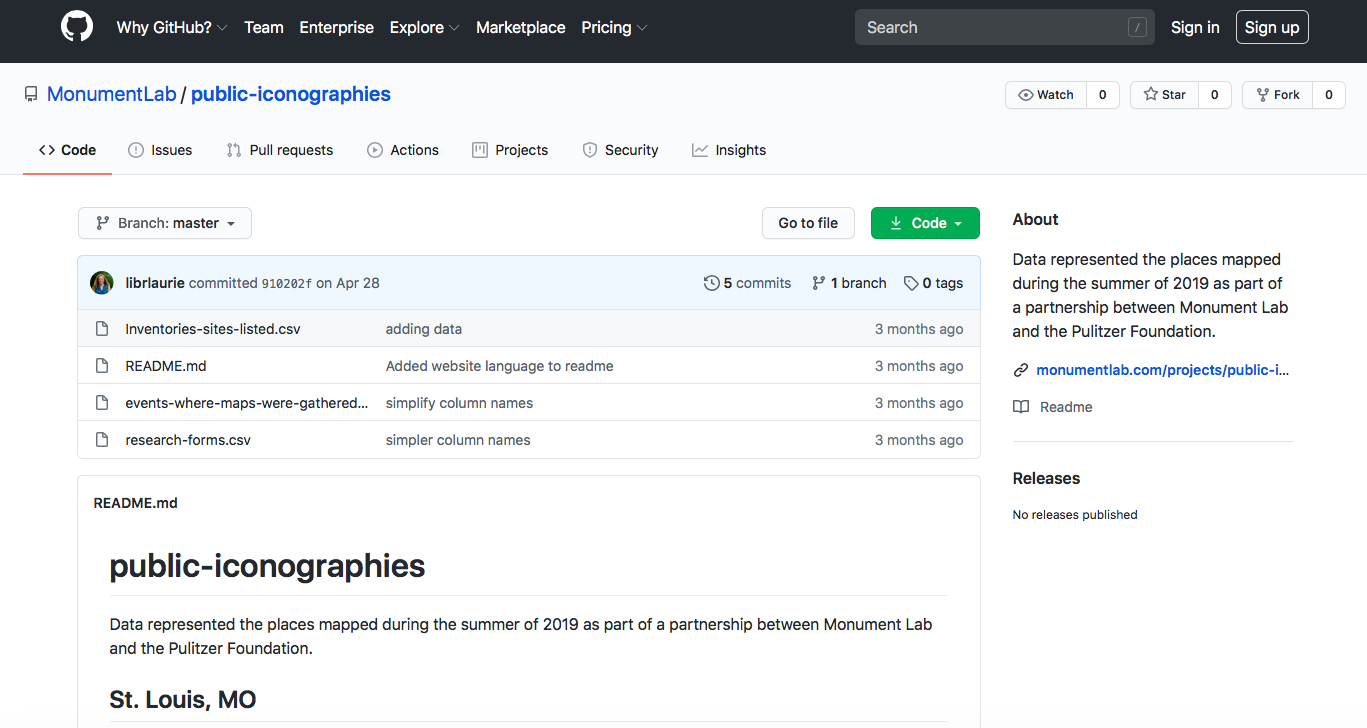
This past summer I was one of three Research Associates working on Monument Lab’s Public Infographics research residency at the Pulitzer Arts Foundation. We spent four months collecting 750 maps from 46 events and created an inventory of 1,044 places. From this grew a robust dataset that I consider one of the most valuable, if not the most valuable, cultural public good in the region. Why is the dataset important? What can we learn from it?

As a P.h.D student whose primary research interests are cultural policy and research methodology, I know that arts and culture datasets are hard to find. Like, really hard to find—I can’t name more than ten off the top of my head. Most are publicly available, although a handful are proprietary and come with a hefty price tag. They largely provide information about things that can be counted: dollars, donors, events, jobs, etc. In the aggregate, these numbers broadly, and coldly, paint the cultural sector, capturing its instrumental, not intrinsic value. The data collected during Monument Lab’s research residency is unique because it is free, locally produced, locally owned, and records the symbols, sites, and experiences that make up the fabric of our everyday lives. In short, the dataset tells a story of the region’s culture making it a relevant, useful, and powerful resource. It’s up to us to use it to give account, not simply to count.

To see what we can learn from the dataset, we’ll look at just a slice of it, imagined places, as an example. All places recorded on maps are categorized by one of three statuses: erased/demolished, marked/current, or potential/imagined. The latter occurs least frequently though it provides a compelling frame for meaning making. Interestingly, these imagined places are at least twelve times more likely to be an artwork (instead of an institution, infrastructure, neighborhood, park space, etc.) than the two other categories. In fact, almost half (48.2 percent) of all imagined places are artworks—a testament to the social imagination of participants. The dataset reasserts the role of art in the region: to celebrate or memorialize histories, mark lived experiences, and address discrimination that mantles the region.

Imagined artworks include a range of ideas for monuments that center the history and cultures of those often at the periphery: Black and LGBTQ residents, Indigenous people, and artists. About 15 of the 39 artworks (38.0 percent) are Black historical figures, who either were born or lived in St. Louis, like Mary Meachum, Redd Foxx, Katherine Dunham, Dick Gregory, Maya Angelou, and Henry Armstrong. The remaining imagined artworks include monuments and murals celebrating artists, immigrants, educators, and more. If any public official (or anyone with enough power or money) is wondering what monuments should be erected in the region this list is a great place to start.
There is so much that local governments, funders, institutions, and other decision makers can learn from this dataset: patterns of cultural participation, geographical distribution and location of cultural assets, opportunities to support “natural” cultural districts, expansive definitions of cultural activity and assets, the important role that culture plays in individual lives, and more. Needless to say, creatives can make good use of this data as well, either similarly or for their own inventive ends. Above all, I hope participants and publics can use the data to answer their questions, see their stories, and find notable, often undertold, accounts of the region.
Whoever you are: dig in, let your curiosity guide you, and explore the diverse and complex cultural stories of the people who live, work, and visit the region.
